VETERANS AND HOUSING

Some of the longest running programs for housing assistance serve veterans. These federal and state programs provide loans, case management, and rental assistance to veterans. But these supports are modest. One in four veteran households experiences housing cost burden (having housing expenses that exceed 30% of their income). Furthermore, 1.5 million veteran households spend more than 50% of their income on housing (NLIHC 2013). And stark inequities exist between white male veterans and women and Black veterans.

For low-income veterans today, there’s VASH: Veteran’s Affairs Supportive Housing. It is a collaborative program between HUD and VA. HUD housing vouchers are paired with VA supportive services. There’s a focus on helping veterans who are homeless and their families find and sustain permanent housing. As of Sept. 30, 2015, HUD had allocated more than 78,000 vouchers to help house veterans across the country (VA 2020).

In addition to federal VA housing programs, states own and operate assisted living facilities for veterans. “State Veterans Homes are facilities that provide nursing, domiciliary or adult day care. They are owned, operated and managed by state governments. They date back to the post-Civil War era when many states created them to provide shelter to homeless and disabled Veterans (VA 2020).”

Low-income veterans can access Supportive Services for Veteran Families (SSVF). This program provides case management and supportive services. The goal is to prevent the imminent loss of a veteran’s home or identify new, more suitable housing situations. Case managers assist in re-housing veterans and their families who are homeless (VA 2020). Still seven in ten veteran households at or below 30% of the area median are severely housing cost burdened (NLIHC 2013).

The VA home loan program is very popular. It was conceived in 1944 to attack on the harsh aftermath associated with wars (ArmyTimes 2017). It is important to keep in mind that these loans were not historically provided to Black veterans. Black veterans were systematically denied the benefits of the post-World War II GI Bill. They were not provided generous home loans, business loans, and educational and job-training benefits that white veterans saw. Of the 3,229 GI Bill business, farm, and home loans made in Mississippi throughout 1947, only two were offered to Black veterans (Opportunity Starts at Home 2020).

Discrimination around veteran benefits is no longer explicit. But generations of Black veterans have been excluded from inter-generational wealth building opportunities that white veterans experienced. Inequity persists to today. According to NLIHC, “more than half of Black, non-Hispanic veteran households with incomes between 50% and 80% of the area median are housing cost burdened, compared to 36% of white, non-Hispanic, and 48% of Hispanic veteran households in the same income category,” (NLIHC 2013).

REFERENCES

RI Coalition for the Homeless | State of Homelessness
https://www.rihomeless.org/state-of-homelessness

Army Times | VA Loan Center
https://www.armytimes.com/home-hq/va-loan-center/2017/12/14/va-loan-history-101-from-world-war-ii-to-todays-benefit/

VA | Housing Services
https://www.va.gov/homeless/housing.asp#:~:text=For%20very%20low%2Dincome%20Veterans,homeless%20and%20might%20remain%20homeless

Opportunity Starts at Home | Racial Equity Fact Sheet 2020
https://www.opportunityhome.org/wp-content/uploads/2020/10/Final-Racial-Equity-Page-Fact-Sheet.pdf

NLIHC | Veteran Report 2013
https://nlihc.org/sites/default/files/NLIHC-Veteran-Report-2013.pdf

YOU WOULDN’T GUESS THESE PEOPLE WERE DISCRIMINATED AGAINST

If you want to do a deep dive on child well-being in Rhode Island, we urge you to check out the 2020 RI Kids Count Factbook. It’s a great resource of data that informed this post.

There’s a group we may not think of when we talk about housing discrimination: kids. A study in 2002 showed that only 38% of respondents knew that it was illegal to discriminate against families when they’re looking for homes (Harvard 2013).

Housing stability and conditions are directly linked to childhood development. Housing is health. Housing is education. A look at court-ordered eviction records shows that neighborhoods with larger percentages of children experience more evictions. A 1% increase in the percentage of children generally increases that neighborhood’s eviction rate by 6.5 percent. Households with children are 17% more likely to receive and eviction judgement than households without children (Harvard 2013).

Compared to other states, Rhode Island kids are hit hard. Rhode Island invests only one-fifth per-capita what neighboring Massachusetts does in affordable housing. Between 2013 and 2018, Rhode Island saw average cost of a single family home rise 22% (RI Kids Count 2020). The quality of housing correlates with lower kindergarten readiness scores. Those scores are worse if the child’s house is in foreclosure, in tax delinquency, or if it is owned by a speculator (Housing Matters 2019).

In 2019, 579 (2%) of the 23,947 Rhode Island children under age six who were screened had confirmed elevated blood lead levels of ≥5 µg/dL. Children living in the four core cities (4%) were four times as likely as children in the remainder of the state (1%) to have confirmed elevated blood lead levels of ≥5 µg/dL. (RI Kids Count 2020)

For Rhode Island’s high schools in the Class of 2019, the graduation rate was 65% for homeless students and 84% for non-homeless students. And 25% of homeless students met expectations on the third grade Rhode Island Comprehensive Assessment System (RICAS) English language arts assessment compared to 48% of non-homeless students (RI Kids Count2020).

In 1954, the case Brown v. Board of Education of Topeka established that any law that established segregation in schools was unconstitutional. But segregation persists. A study in 2016 found that half of schools in the US were more than 75% white or 75% nonwhite. (New York Times 2019) And because funding for schools is still tied to local taxes, a starkly unequal system is created for children and teachers.

The most dramatic impacts are on homeless children. In the United States each year, one in 30 children are homeless. That’s 2.5 million children who experience homelessness each year. According to Rhode Island Kids Count 2020 Factbook, “in 2019, 279 families with 603 children stayed at an emergency homeless shelters, domestic violence shelters, or transitional housing facility in Rhode Island. Children made up 21% of the people who used emergency homeless shelters, domestic violence shelters, and transitional housing in 2019. Nearly half (44%) of these children were under age five.” (RI Kids Count 2020)

Evidence shows that investments in housing have dramatic effects on child development and educational outcomes. That’s why we need long-term sustained investment in the production of affordable homes. Community revitalization efforts in public housing improve math and reading scores of elementary school students (Housing Matters 2018). Children who live in HUD–assisted households have half the prevalence of elevated blood lead levels than children in non-assisted low-income families (Housing Matters 2019).

RESEARCH

Evicting Children | Harvard | Matthew Desmond 2013

When Renters Move, What Factors Affect Student Test Scores? | Housing Matters | Sarah A. Cordes April 01, 2020

2020 Rhode Island Kids Count Factbook | Kids Count RI | 2020

Stable Housing Can Launch Youth Leaving Foster Care on a Path to Success | Housing Matters | Maya Brennan June 19, 2019

How Housing Affects Children’s Outcomes | Housing Matters | Veronica Gaitán January 02, 2019

Community Revitalization Efforts Can Improve Public School Performance | Housing Matters | Donna Comrie July 25, 2018

Late Rent Payments Can Harm Health Outcomes of Caregivers and Children | Housing Matters | Megan Sandel February 01, 2018

STATS

After moving, students experienced a negative effect on math scores in both the short term and the long term. | Housing Matters 2020

An analysis of court-ordered eviction records to demon-strate that neighborhoods with larger percentages of children experience higher evictions. All else equal, a 1 percent increase in the percentage of children is predicted to increase a neighborhood’s evictions by 6.5 percent. | Harvard 2013

On average, the probability of a household with children to receive an eviction judgment is about 17% higher than that of a household without children. | Harvard 2013

When in 1980 HUD commissioned a nationwide study to assess the magni-tude of the problem, researchers found that “only one quarter of rental housing units [were] available to families with children with no restrictions. | Harvard 2013

In 2009, 20 percent of all HUD complaints alleged discrimination based on family status. | HUD 2010

Unlike discrimination based on race or gender, discrimination against fami-lies and children often is not even recognized as discrimination. A report based on a nationwide sample of Americans found that the majority of respondents recognized discrimination based on race, religion and ability to be illegal, but only 38 percent were “aware that it is illegal to treat households with children differently from households without children”. | Harvard 2013

Between 2014 and 2018, in Rhode Island, the median family income for married two-parent families ($105,323) was more than twice that of male-headed single-parent families ($45,491) and more than three and a half times that of female headed single-parent families ($28,585). | Kids Count RI 2020

While Rhode Island’s unemployment rate has declined, many workers remain unable to find full-time employment and struggle to make ends meet with inadequate and unpredictable income. As of 2016, almost 24 million people in the U.S. worked in low-wage jobs where they were paid $11.50 per hour or less. | Kids Count RI 2020

In Rhode Island over the past few decades, income inequality has grown. In 2015, the top 1% ($928,204) of Rhode Island households had average incomes that were 18 times more than the bottom 99% ($50,963) of households. Rhode Island is ranked 32nd of the 50 states in income inequality based on the ratio of top 1% to bottom 99% income. | Kids Count RI 2020

In 2019, a worker would have to earn $31.75 an hour and work 40 hours a week year-round to be able to afford the average rent in Rhode Island without a cost burden. This hourly wage is more than three times the 2019 minimum wage of $10.50 per hour. | Kids Count RI 2020

2018 Rhode Island Standard of Need, it costs a single-parent family with two young children $55,115 a year to pay basic living expenses, including housing, food, health care, child care, transportation, and other miscellaneous items. This family would need an annual income of $62,844 to meet this budget without government subsidies. | Kids Count RI 2020

Between 2013 and 2018 the median cost of a single family home in Rhode Island rose 22%. While median wages only increased 13% in that time. | Kids Count RI 2020

In 2018m Rhode Island only invested 1/5 the per capita amount that Massachusetts does in affordable housing. | Kids Count RI 2020

Rhode Island law establishes a goal that 10% of every community’s housing stock qualify as Low- and Moderate-Income Housing. Currently, only six of Rhode Island’s 39 cities and towns meet that goal. | Kids Count RI 2020

In the United States, 2.5 million children (one in 30) are homeless each year. | Kids Count RI 2020

In 2019, 279 families with 603 children stayed at an emergency homeless shelter, domestic violence shelter, or transitional housing facility in Rhode Island. Children made up 21% of the people who used emergency homeless shelters, domestic violence shelters, and transitional housing in 2019. Nearly half (44%) of these children were under age five.| Kids Count RI 2020

In Rhode Island in 2019, 25% of homeless students met expectations on the third grade Rhode Island Comprehensive Assessment System (RICAS) English language arts assessment compared to 48% of non-homeless students. | Kids Count RI 2020

In Rhode Island, the four-year high school graduation rate for the Class of 2019 was 65% for homeless students and 84% for non-homeless students. | Kids Count RI 2020

Children who live in US Department of Housing and Urban Development–assisted households have half the prevalence of elevated blood lead levels than children in nonassisted low-income families, after adjustment for demographic, socioeconomic, and family characteristics. These data suggest that low-income families could see improved health benefits for their children either increased access to subsidized housing or increased lead remediation and regulations on existing unassisted housing. | Housing Matters 2019

Living in poor-quality housing and disadvantaged neighborhoods is associated with lower kindergarten readiness scores. Further, children living in homes that were in foreclosure, in tax delinquency, or owned by a speculator were more likely to receive worse kindergarten readiness scores than children in stable housing. | Housing Matters 2019

Evidence indicates that community revitalization efforts in public housing improve math and reading scores of elementary school students. | Housing Matters 2018

More than 40 percent of youth aging out of the child welfare system experience housing instability within two years of leaving foster care. | Housing Matters 2019

LGBTQ DISCRIMINATION IN HOUSING

This past week we saw two different faces of America. On June 15, “LGBT rights advocates triumphed at the Supreme Court Monday, winning a sweeping decision from the justices that protects gay, lesbian and transgender employees from being disciplined, fired or turned down for a job based on their sexual orientation.” (Politico 2020) The other face was more sinister, focused on hate and cruelty: “The Trump administration on Friday finalized a rule that would remove nondiscrimination protections for LGBTQ people when it comes to health care and health insurance.” (NPR 2020) This means that LGBTQ patients can be denied healthcare or health insurance for gender identity or sexual orientation.

When we talk about housing stability, one of the key metrics is housing cost burden: how much of someone’s income goes to paying for housing. If someone pays more than 30% of their income in housing costs, they are considered cost burdened. If they pay more than 50%, they are severely cost burdened. Up until last week, LGBTQ Americans were at risk of losing their job at any given moment. This reveals the structure of the system that marganalizes LGBTQ Americans and shows how sinister the Trump administration’s rule is: without healthcare, we cannot keep our jobs when we get hurt or become sick; without jobs, we cannot have housing stability.

In addition to the systemic barriers, LGBTQ Americans face direct bigotry from the housing industry. Housing providers were less likely to make an appointment with gay male couples. For every 4.2 available rental units mentioned to heterosexual couples, gay couples were told about 1 fewer unit. They were also quoted higher rents. (Housing Matters 2018) One in five trans people have been refused housing on the basis of gender identity (NCTE 2020). One in 10, or 3.5 million, youths ages 18 to 25 experienced homelessness over a 12-month period, but LGBTQ youth had a risk of homelessness 120 percent higher than heterosexual, cisgender youth. (Housing Matters 2018)

But at the state level, there are possible wins to prevent housing discrimination. Forty-two percent (42 %) of the U.S. LGBTQ population lives in states that do not prohibit housing discrimination based on sexual orientation or gender identity. (lgbtmap.org 2020) Only 22 states have laws prohibiting housing discrimination based on sexual orientation, and 20 of the 22 prohibit housing discrimination based on gender identity. (Urban 2017)

Rhode Island is one of those 20 states that added LGBTQ as a protected category to the Fair Housing Act. This created a legal framework for Rhode Island residents to protect themselves against discrimination based on gender identity and sexual orientation. Other states can adopt similar measures.

These complex systems, housing, poverty, racism, LGBTQ rights, healthcare, and so on, reveal the ways they are interconnected and influence each other. Housing justice work must be both deliberate and specific and consider the intersections of different forms of oppression. While we must act globally to ensure everyone has a safe, healthy and affordable home, we must also act deliberately and specifically to ensure our LGBTQ community have homes.

RESEARCH

A Paired-Testing Pilot Study of Housing Discrimination against Same-Sex Couples and Transgender Individuals | Urban | Diane K. Levy June 30, 2017

Discrimination is limiting LGBTQ people’s access to rental housing | Urban | Diane K. Levy August 2, 2017

State Maps of Laws & Policies that Affect the LGBTQ Community | Human Rights Campaign | April 15, 2020

Equity Map: LGBTQ Nondiscrimination Laws | lgbtmap.org | June 2, 2020

HUD to change transgender rules for single-sex homeless shelters | Washington Post | Paige Winfield Cunningham June 14, 2020

HUD Proposal to Weaken LGBTQ Access to Emergency Homelessness Services Clears OIRA | NLIHC | Jun 08, 2020

Five Facts about Housing Access for LGBT People | Housing Matters | Maya Brennan June 13, 2018

50 Years After Fair Housing Act, LGBT People Still Vulnerable to Housing Discrimination |Sage | Kelly Kent April 11, 2018

Evidence of Housing Discrimination Based on Sexual Orientation and Gender Identity | Williams Institute | February 2016

Ending LGBTQ Housing Discrimination Will Take More Than Reform, Advocates Say | Bustle | Leila Barghouty Dec. 5, 2019

Financial Services and the LGBTQ+ Community: A Review of Discrimination in Lending and Housing | House Committee on Financial Services | House Committee on Financial Services October 29, 2019

New Report on Youth Homeless Affirms that LGBTQ Youth Disproportionately Experience Homelessness | Human Rights Campaign November 15, 2017

2015 U.S. Transgender Survey | National Center for Transgender Equity 2016

STATS

Only 22 states have laws prohibiting housing discrimination based on sexual orientation, and 20 of the 22 prohibit housing discrimination based on gender identity. | Urban 2017

Only 17 states offer protections against discrimanation for gender identity | Human Rights Campaign 2020

One in 10, or 3.5 million, youths ages 18 to 25 experienced homelessness over a 12-month period, but LGBT youth had a risk of homelessness 120 percent higher than heterosexual, cisgender youth. | Housing Matters 2018

One in five trans people have been refused housing on the basis of gender identity. | NCTE 2020

Housing providers were less likely to make an appointment with gay male couples, told them about 1 fewer available rental unit for every 4.2 they mentioned to heterosexual men, and quoted higher rents.| Housing Matters 2018

42% of LGBTQ population lives in states that do not prohibit employment discrimination based on sexual orientation or gender identity (including 5% of LGBTQ population living in states that preempt local nondiscrimination laws) | lgbtmap.org 2020

42% of LGBTQ population lives in states that do not prohibit housing discrimination based on sexual orientation or gender identit | lgbtmap.org 2020

RACISM AND HOUSING

BLACK LIVES MATTER

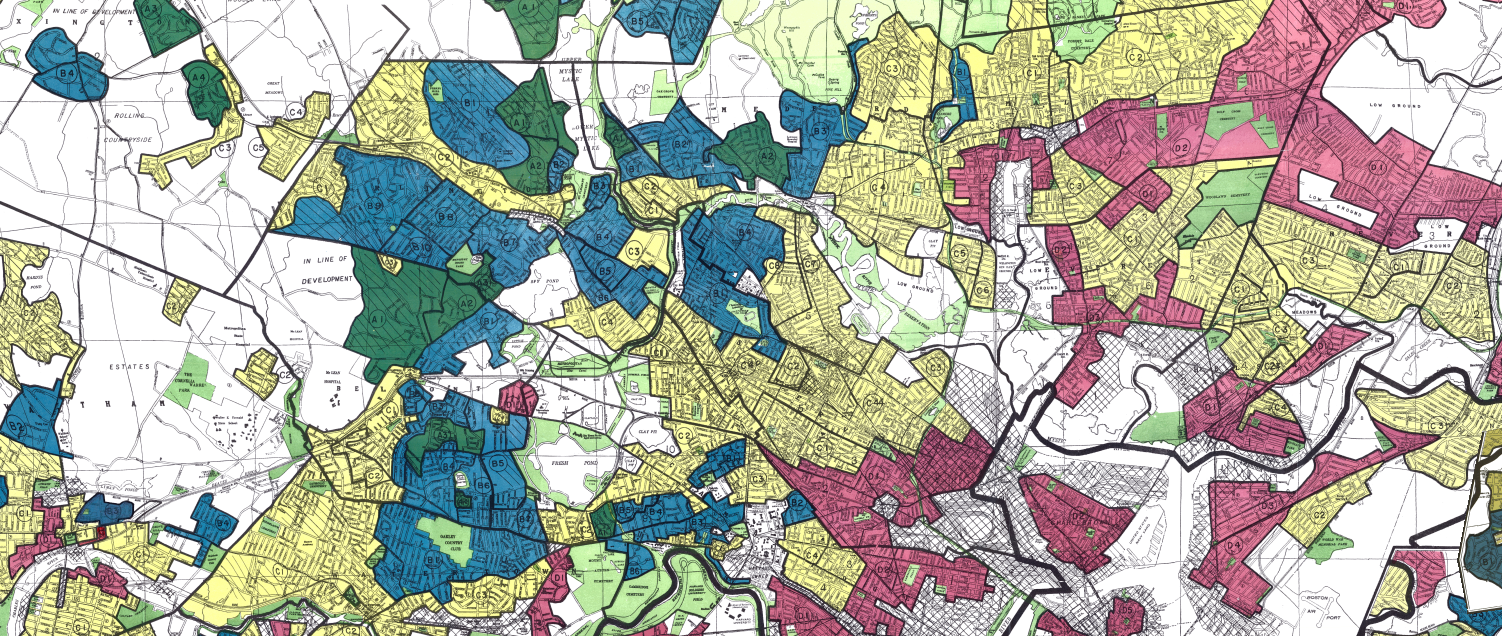
The term ‘redlining’ comes from the practice of government and financial institutions literally drawing red lines on maps around majority Black and brown neighborhoods, designating them as areas where various services would be denied to residents. The practice began with the National Housing Act of 1934, and while redlining formally continued into the 80’s, housing segregation is a persistent problem today.

Redlining is one example of a vast system of inequity, both explicit and unintentional processes that harm communities of color for corporate profit and white privilege. Part of that system is violence and murder committed by the police against Black neighbors. In Kentucky, where Breonna Taylor was murdered by police while in bed, one in four African American adults cannot vote as a result of felony disenfranchisement. This rate of 26.2% is triple the national African American disenfranchisement rate of 7.44%. (Prison Policy, 2020)

As a result of COVID-19, the United States is poised to see an avalanche of evictions. The government shut down parts of the economy, and people lost their jobs. But rent is still due. The few eviction moratoriums that existed are being lifted. People will be kicked out of their homes unless we act now to protect them.

On average, Black renters have evictions filed against them by landlords at nearly twice the rate of white renters. (ACLU, 2020) In April, while white Americans lost jobs due to COVID-19 at a rate of 14.2%, Latino and Black Americans were significantly more likely to lose their jobs: Latino unemployment reached a record high of 18.9 percent, and Black unemployment reached 16.7 percent. (Urban Institute, 2020)

States that have eviction moratoriums must continue them. States that don’t have them need to enact them. But that’s not enough. We need systems and funding to fill the gaps, rental assistance and eviction diversion courts.

In Rhode Island, there is no eviction moratorium. The State began filing evictions from before the quarantine at the start of this month, and it will begin processing COVID-related evictions in July. Eviction Lab has rated RI .38 out of 5 stars on our states policies, and The State only provided rental assistance for a small number of families.

But rental assistance and moratoriums are temporary fixes. New sustained funding for building and operating deed-restricted affordable homes must be created. Rhode Island is the only state in New England that does not have dedicated, sustained funding for affordable housing. Even before the pandemic, Rhode Island had the lowest rental vacancy rate in New England, and its production was down significantly from historical averages.

Below is a list of articles about racism in housing, followed by selected stats pulled from those articles.

RESEARCH /ARTICLES TO LEARN MORE

STRUCTURAL RACISM

The Case for Reparations | The Atlantic | Ta-Nehisi Coates June 1, 2014

Living Apart: How the Government Betrayed a Landmark Civil Rights Law | Propublica | Nikole Hannah-Jones June 25, 2015

Racial Disparities Among Extremely Low-Income Renters | NLIHC | The Gap Apr 15, 2019

Racial Disparities in Home Appreciation | Center for American Progress | Michela Zonta July 15, 2019

Metro areas are still racially segregated | Brookings | Jenny Schuetz December 8, 2017

Another Way to Achieve Racial Justice: Zoning Reform | Planetizen | James Brasuel June 14, 2020

Racial Disparity in Home Lending Is Today’s Redlining | Planetizen | Lee Flannery June 11, 2020

The Unsurprising Reason More Black Americans Are Becoming Homeless | Curbed | Alissa Walker Jun 10, 2020

Racial and ethnic price differentials in the housing market | Science Direct | Patrick Bayer November 2017

Clearing the Record: How Eviction Sealing Laws Can Advance Housing Access for Women of Color | ACLU | Sophie Beiers January 10, 2020

State of Homelessness: A Look at Race and Ethnicity | NAEH | Joy Moses May 27, 2020

A Look At Housing Inequality And Racism In The U.S. | Forbes | Dima Williams June 3, 2020

Does Whiteness Explain Local Land-Use Patterns? | Housing Matters | Jessica Trounstine May 20, 2020

Housing Justice is Racial Justice | NLIHC | Diane Yentel, NLIHC President and CEO Jun 08, 2020

A ‘Forgotten History’ Of How The U.S. Government Segregated America | NPR | Terry Gross May 3, 2017

COVID + HOUSING + RACE

Black community braces for next threat: Mass evictions | Politico | Katy O’Donnell June 16, 2020

How Economic Crises and Sudden Disasters Increase Racial Disparities in Homeownership | Urban Institute | Michael Neal + Alanna McCargo June 2020

New Data Suggest COVID-19 is Widening Housing Disparities by Race and Income | Urban Wire | Alanna McCargo &Solomon Greene May 29, 2020

COVID-19 crisis highlights housing inequality faced by black Americans | Yahoo Finance | Brian Cheung June 3, 2020

Behavioral Health Disparities in Black and Brown Communities: Making the Connection Between COVID-19 and Racism |NAEH | Chandra Crawford June 8, 2020

Systemic racism and coronavirus are killing people of color. Protesting isn’t enough | National Geographic | Ruddy Roye June 4, 2020

It’s getting even harder for black and Latino tenants to pay the rent | CNN | Anna Bahney June 5, 2020

How COVID-19 threatens black homeownership | Housing Wire | Alcynna Lloyd May 18, 2020

‘The housing emergency most harms people of color:’ Black Americans face an unequal housing market — and coronavirus could make it worse | Market Watch | Jacob Passy Jun 3, 2020

The Intersection of Homelessness, Race, and the COVID-19 Crisis | NAEH April 7, 2020

LOOKING FORWARD

To Equitably Connect Housing and Economic Mobility for Black Americans, Tackle Structural Racism | Housing Matters | Janae Ladet February 08, 2018

The Alliance’s Racial Equity Network Action Steps (Tool Kit) | NAEH | February 3, 2020

20th Century African Heritage Civil Rights in Rhode Island | Rhode Island Historical Society

How to Put Racial Equity at the Center of Neighborhood Investment | Housing Matters |Kimberly Burrowes February 19, 2020

Four Ways to Integrate a Structural Racism Lens into Neighborhood Health Research | Housing Matters | Alicia R. Riley May 01, 2019

Black Lives Matter: Solidarity and action | Results.org | Joanne Carter June 2nd, 2020

STATS

STRUCTURAL RACISM

Homeownership is one of the only paths to building wealth for low-income families in the U.S. In 2016, 58% of black household heads and 54% of Hispanic household heads were renting their homes, compared with 28% of whites. | 2016 data from the Pew Research Center

In 2015, 46 percent of African-American-led renter households were rent burdened, compared with 34 percent of white households. Between 2001 and 2015, the gap between the share of white and African- American households experiencing severe rent burden grew by 66 percent. | 2018 Pew

In 2015, according to Pew, less than two-thirds of black and Hispanic households held home loans with rates below 5%. Some 73% of white and 83% of Asian households had such mortgages. | 2020 Forbes

Even African-Americans with similar credit profiles and down-payment ratios to white borrowers were more likely to receive subprime loans, according to the study.As a result, from 1993 to 2000, the share of subprime mortgages going to households in minority neighborhoods rose from 2 to 18 percent,

On average, Black renters had evictions filed against them by landlords at nearly twice the rate of white renters. | 2020 ACLU

Assuming she and her white, non-Hispanic male counterpart begin work at age 20, a Black woman would have to work until she is 86 years old to catch up to what a white, non-Hispanic man has been paid by age 60. Black women working full time, year-round are paid only 61 cents for every dollar paid to their white, non-Hispanic male counterparts. | 2019 National Women’s Law Center

Hispanic homebuyers pay premia of around 2% on average across the four cities — differences not explained by variation in buyer income or access to credit. | 2017 Science Direct

High-poverty neighborhoods are made up of 43% Black, 31% Hispanic, and only 13% White. While low-poverty neighborhoods are made up of 9% Black, 11% Hispanic, and 33% White. Zip code is the strongest indicator of economic mobility and health outcomes. | 2020 NLIHC

Blacks continue to have lower rates of upward mobility than whites. In 2016, the median black and Hispanic worker earned 65% and 63% of the median white worker, respectively. | 2019 NLIHC

When cities are greater than 15 percentage points whiter than the metro area, they are more likely to restrict land use. In addition to whiteness, homeownership and wealth also positively predict land-use restriction. | 2020 Housing Matters

Today African-American incomes on average are about 60 percent of average white incomes. But African-American wealth is about 5 percent of white wealth. Most middle-class families in this country gain their wealth from the equity they have in their homes. So this enormous difference between a 60 percent income ratio and a 5 percent wealth ratio is almost entirely attributable to federal housing policy implemented through the 20th century. | 2017 NPR

African Americans represent thirteen percent of the general population but are forty percent of people experiencing homelessness and more than fifty percent of homeless families with children. Black families are twenty-six percent of all extremely low-income renters. | 2020 NLIHC

COVID + HOMES + RACE

In April, while the white Americans lost jobs due to COVID at a rate of 14.2%, Latino and Black Americans were significantly more likely to lose their jobs: Latino unemployment reached a record high of 18.9 percent, and Black unemployment reached 16.7 percent. | 2020 Urban Institute

About a quarter of Black and Latino renters were not able to pay rent due to COVID in May, compared to 14 percent of white renters. Among people with mortgages, 28 percent of Black homeowners did not pay or deferred their mortgage in May 2020, compared with only 9 percent of white homeowners. | 2020 Urban Institute